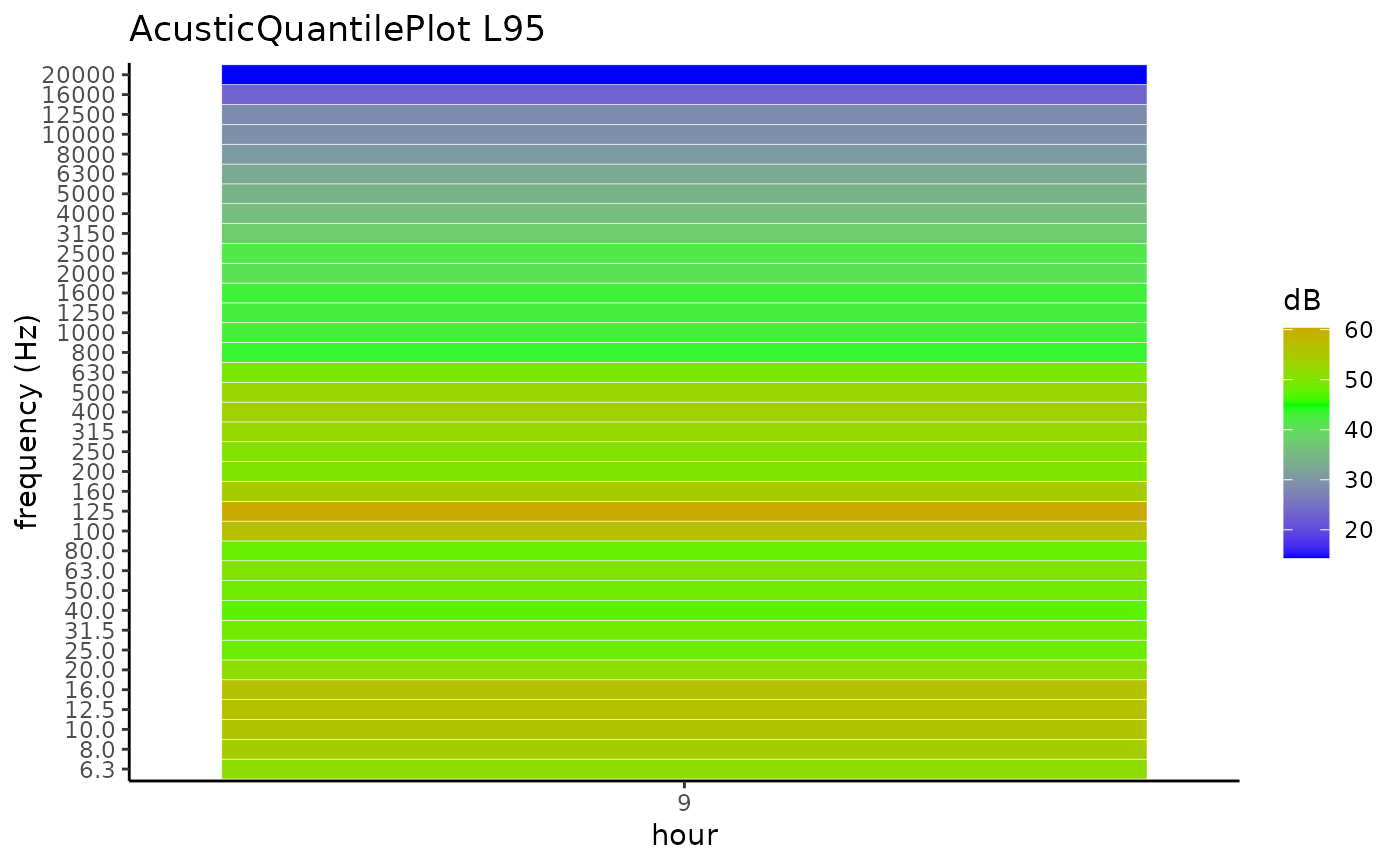
Returns a plot of acoustic quantile of 1/3 band frequency
Examples
# Plot reverse quantile of 1/3 band frequency

library(lubridate)
#>
#> Attaching package: ‘lubridate’
#> The following objects are masked from ‘package:base’:
#>
#>     date, intersect, setdiff, union

datasetI <- dataset_impulsive1
datasetH <- dfImpulsiveTrasform(datasetI)

AcousticQuantilePlot(df = datasetH, Cols =c(3:38), Quantile = 0.95,
                     TimeZone = "UTC")

