Usage
PlotNoiseTHcompare(
  df,
  variable,
  listvar = NULL,
  mp,
  runleq = TRUE,
  y_lim = c(20, 80)
)
Arguments
- df
is a dataframe
- variable
is Leq or another variable to plot first
- listvar
are names of frequency component you want compare
- mp
is a misure point
- runleq
is logical value that plot running leq line
- y_lim
y axe range
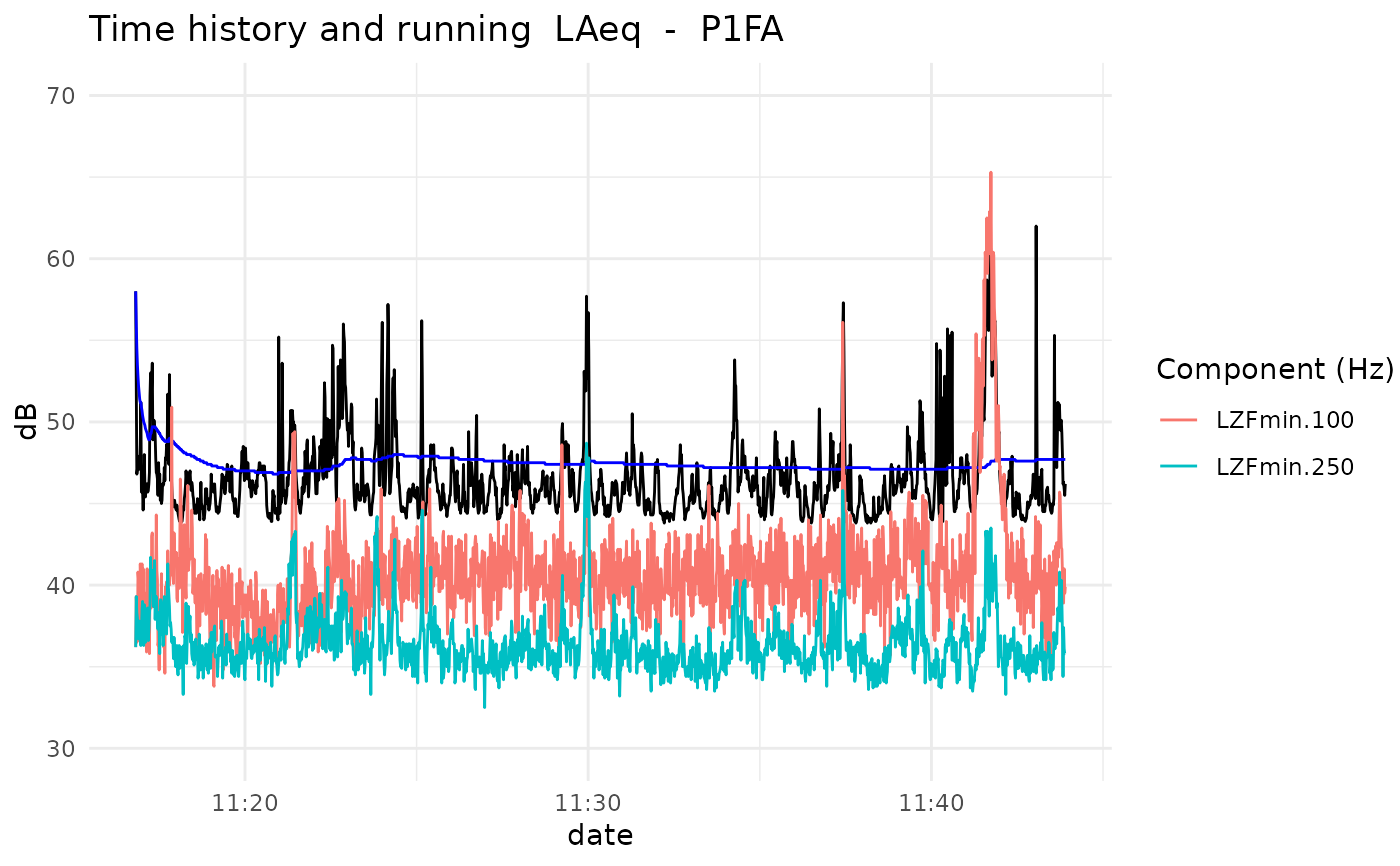
Examples
#data(P1FA)

PlotNoiseTHcompare(df = P1FA ,
                   variable = "LAeq",
                   listvar = c("LZFmin.100",
                               "LZFmin.250"), mp = "P1FA",
                   runleq = TRUE,
                   y_lim = c(30, 70))