Plot time history of noise misure with marker and running Leq
Source:R/OpeNoise.R
PlotNoiseTimeHistory.RdReturns a time history plot
Usage
PlotNoiseTimeHistory(
  df = NULL,
  variable = NULL,
  filemarks = NULL,
  escl_marks = NULL,
  mp,
  y_lim = c(20, 80)
)Examples
#data(P1FA)
#data(markers)

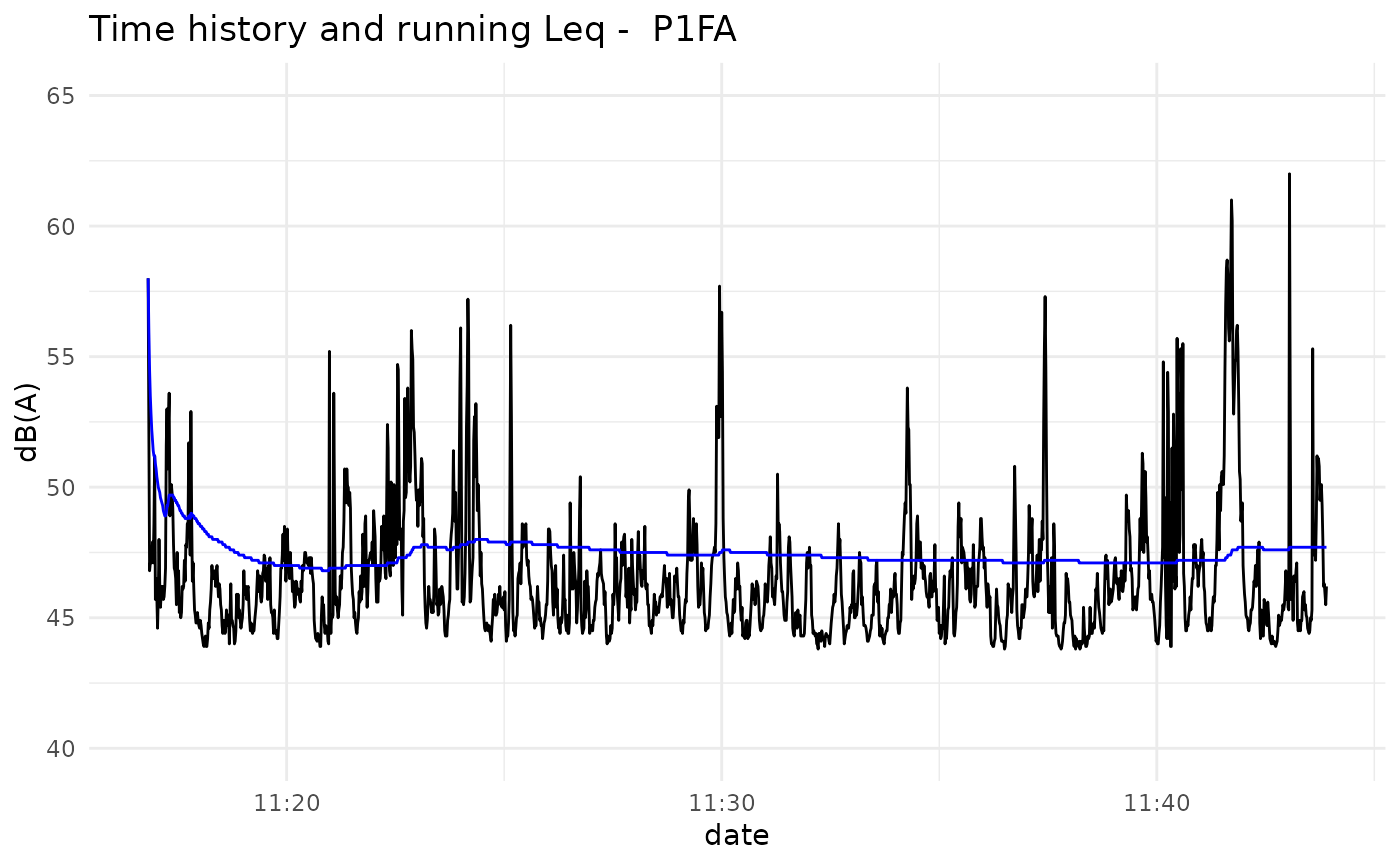
PlotNoiseTimeHistory(df = P1FA, variable = "LAeq", mp = "P1FA", y_lim = c(40, 65))


PlotNoiseTimeHistory(df = P1FA, variable = "LAeq", mp = "P1FA",
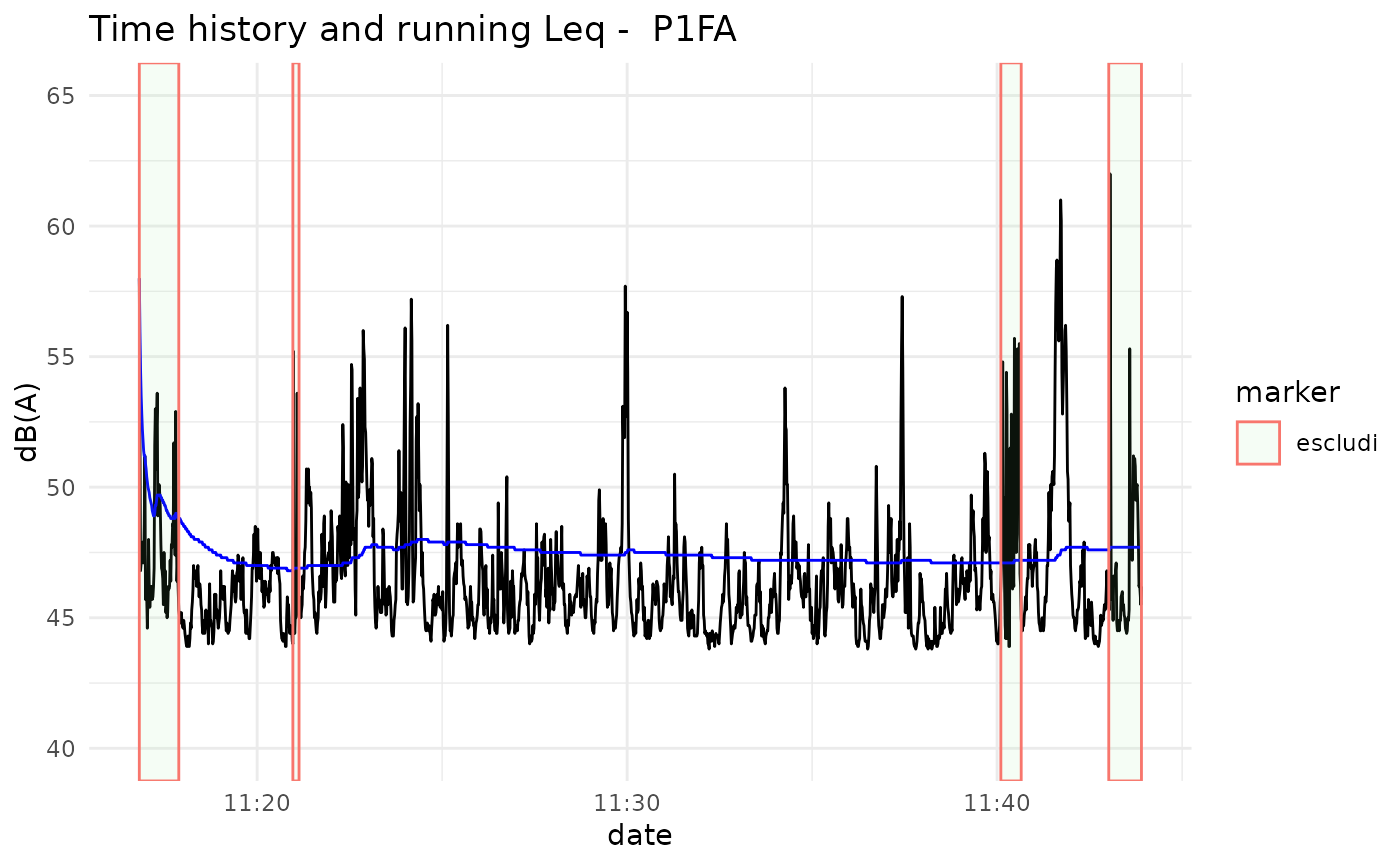
                     filemarks = markers, y_lim = c(40, 65))


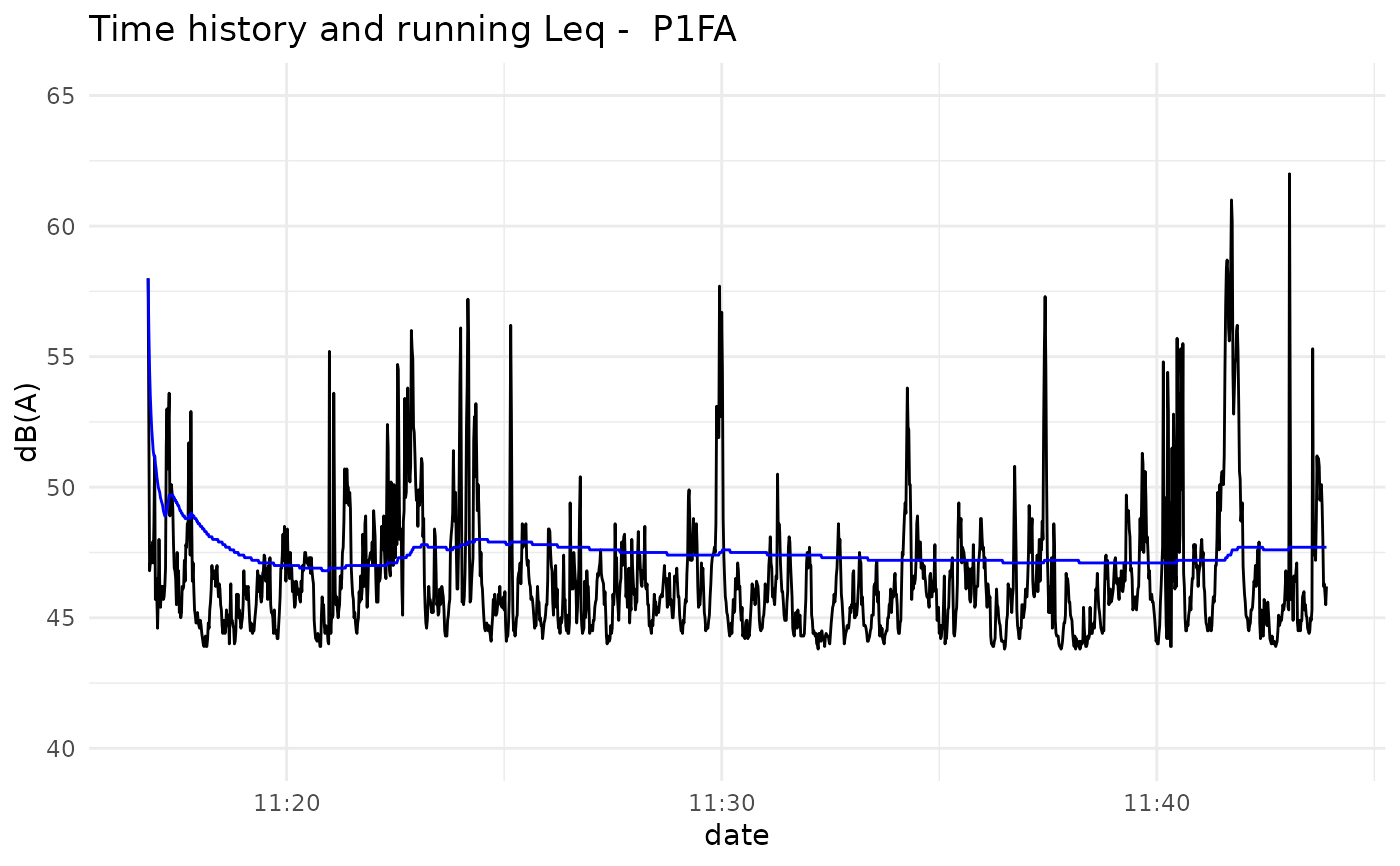
PlotNoiseTimeHistory(df = P1FA, variable = "LAeq", mp = "P1FA", escl_marks = "escludi",
                     y_lim = c(40, 65))
